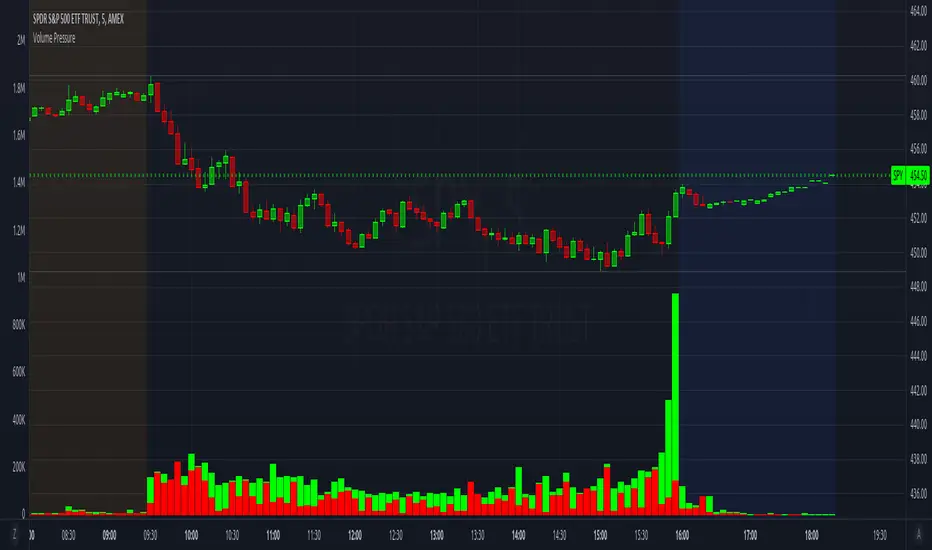
Volume PressureBreaks down volume into buyers (green part) vs sellers (red part).
It is recommended to set the volume's scale, especially if you switch tickers on the same chart. Follow these steps:
Select the Volume Pressure indicator's 3 dots (...)
Select Pin To Scale
Select a separate scale from the main chart, such as Pin To New Left Scale (Z)
Left click and hold the scale on the side of the chart and drag it up/down to bring the volume bars into the desired area
To update to the latest version, just close the indicator and add it again.
Recherche dans les scripts pour "VOLUME BAR"
Volume by SessionThis indicator shows volume separated by session. The aim is clarify which session a volume bar occurred in and how it compares to the average of that session - NOT ALL SESSIONS.
The logic is that there is little value comparing for example the volume of the London session against volume of the London-NY session - the London-NY will always have higher volume. But how does today's london compare to yesterdays london or the london average.
The indicator has moving averages that only consider the average of previous episodes of the same session - so the average on the london session is the average of the past 5 london sessions (NY and asia and London-NY are not included in the calculation of the MA).
The indicator goes as high as 1H timeframe and the average line does not function below 5 mins - thats a limitation on available data to calculate it.
There's also a 'dark screen' function. Thats because I like a black background so the colours need to be inverted.
Hope its useful. Good luck.
John

Volume ComparisonThis script shows the volume of the current chart relative to the volume of another selected ticker.
For meaningful information you should compare coins with the same base pair (for example BTCUSD against LTCUSD).
Volume bars will be plotted green if the other security's volume is higher, red otherwise.
You may use this script go generate alerts and automate your trading with a bot such as WolfBot.org

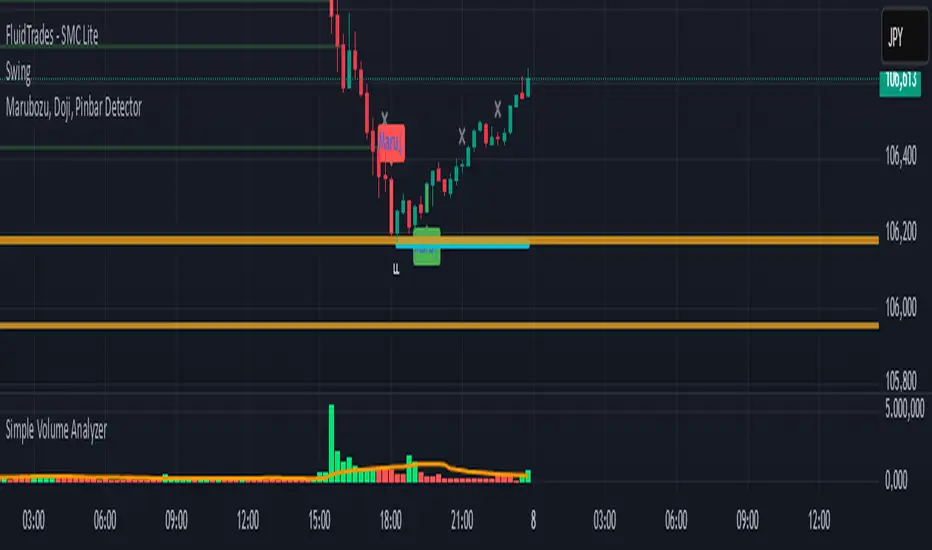
Simple Volume Analyzer..This is a simple yet powerful volume indicator that colors volume bars based on whether they are above or below a moving average. Useful for identifying breakouts and low-volume zones.
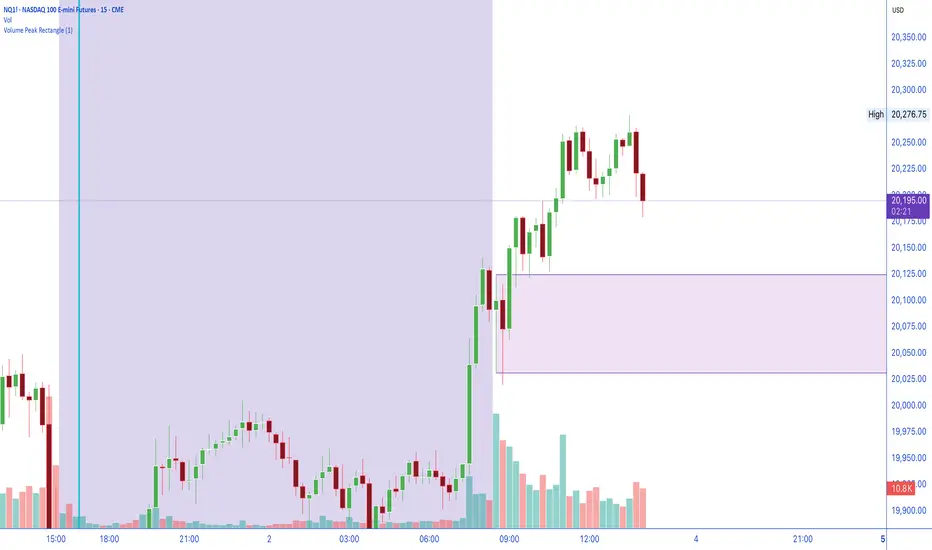
Volume Peak RectangleOutlines the 'Latest' Highest Volume Bar. Typically High Volume bars create very good support and resistance levels. This is a draw off the Opening Range Breakout theory, with the idea that high volume candles create very good upper and lower levels of liquidity zones.
Center of gravity - Mid Point + Volume (PolySlyme)I created an indicator which suits my scalping needs.
First it calculates the mid point of every candle, then it calculates where the closing price is in the candle and converts that to a percentage from the mid point. Then it looks at volume and calculates the difference (Positive/negative) from the previous volume bar and converts that to a percentage. These 2 factors are summed together to give a percentage number (positive or negative) then highlights the positive value. Bullish volume and price action turn to gold.
I use this for scalping to great effect. Enjoy.

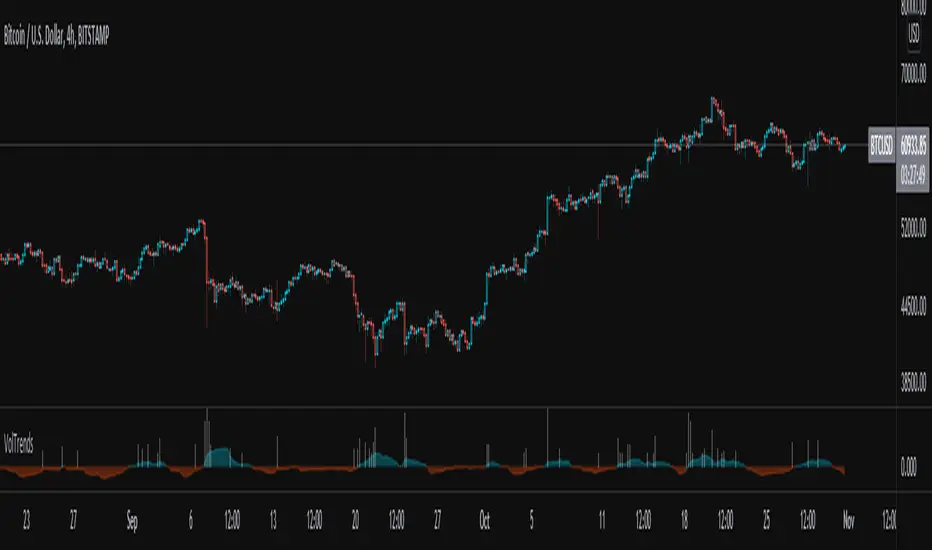
Volume TrendsThis script provides clear volume trends on any time frame. You set a long term volume trend moving average (ex 100 periods). A shorter term MA of your choice (10 in this example) will oscillate above and below based on the standard deviations of its current value relative to the long term #.
Similarly, large volume bars are plotted in terms of st dev above the long term MA.
Very useful in spotting capitulation bottoms and/or blow-off tops.
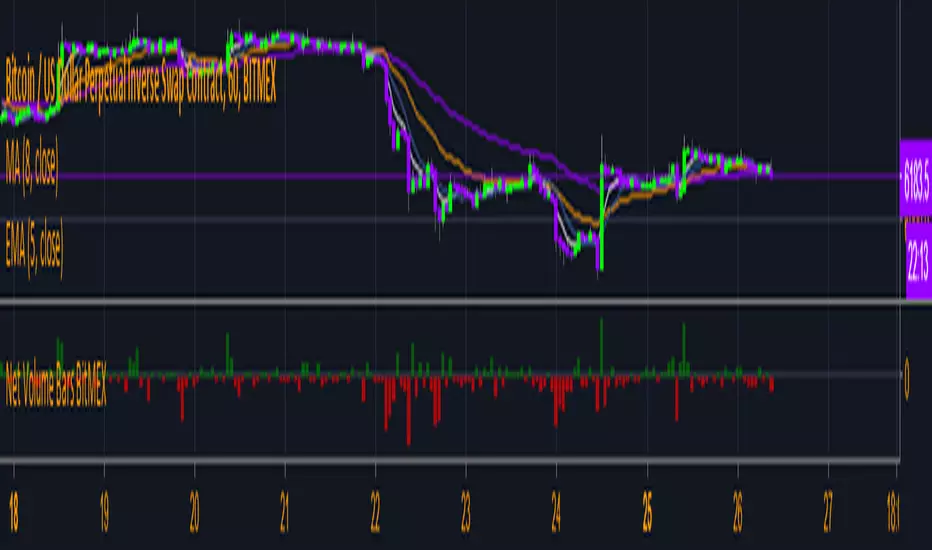
Buy/Sell Volume BarsCalculates buy and sell volume on each candle. Recommended only for visual use - sell volume is same as "total volume" so it will not get covered by buyvolume.

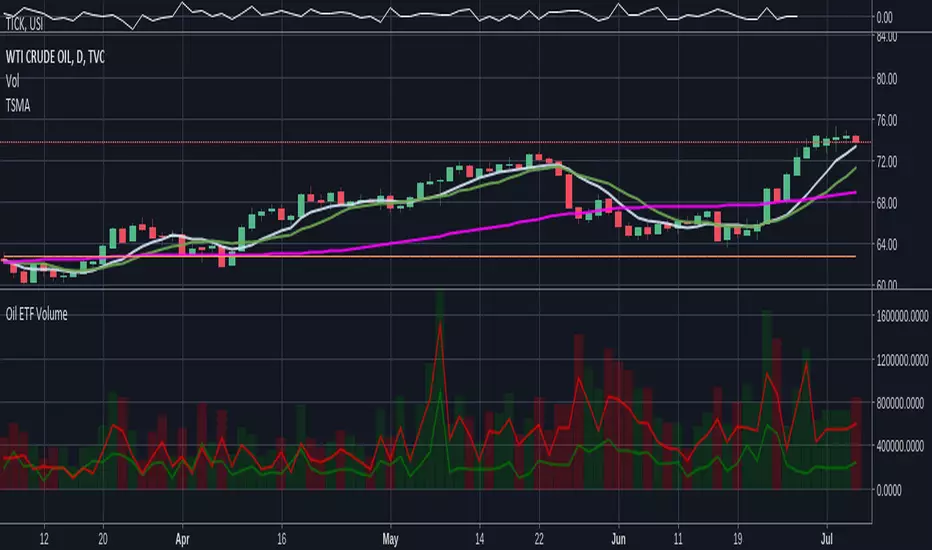
Oil ETF VolumeDirexxion Daily has both 'bear' and 'bull' oil ETFs. This tracks the volume in both combined. It also tracks them individually: the bear ETF is the red line, and bull the green.
NOTE: the color of the volume bars is determined by whatever ticker you're currently looking at, and whether current close is gt/lt previous close. It is intended to be used while looking at the USOIL chart. The colors will be inverted if you're looking at the 'bear' ETF! as the higher closes will actually mean price is going down :D
10% and 23.6% support bandsWhen a share is in momentum and showing lot of strength that relative strength it takes breather at 10% band from new 52 week high and and tends to consolidate at 23.6% from new 52 week high. This forms a higher low and gives opportunity to get in the rally. The volume bars should be taken into consideration as low volume and dry up at the bottom indicate reversal is coming. The stoploss for all entry is 1% below recent base low and entry pont is crossing of weekly high with greater than 20 days volume average.

Moon Scalper v3 + VSAMoon Scalper v3 is a high-precision scalping indicator optimized for the 15-minute chart. It delivers clean buy/sell signals with TP1 (1:1 risk-reward) exits using layered confirmations:
• **Volatility Bands** — SMA + multiplier detect expansion zones
• **EMA Filter (200)** — ensures trades align with trend
• **RSI Range Filter** — avoids extreme overbought/oversold traps (buy: 52–62, sell: 38–48)
• **Volume Spike Filter** — filters for institutional activity (vol > 1.4×SMA)
• **VSA Confirmation** — requires wide-spread, high-volume bars with reclaim (volume × 1.4, spread × 1.5, reclaim 50%)
**Usage Notes:**
Best used on 15m timeframe for liquid pairs (e.g., BTCUSDT, ETHUSDT). Signals appear as “BUY” / “SELL” labels on chart. Defaults yield high TP1 hit rate; use only during active sessions (e.g., London/NY) for best accuracy.
**Disclaimer:**
This indicator is for educational purposes only. Past performance is not a guarantee of future results. Always backtest before live trading and manage risk responsibly.

Candle Close Location MarkerThis script customizes the appearance of candlesticks by highlighting whether the candle closed in the upper, middle, or lower part of its range — using a small orange marker inside each candle.
It also includes a traditional volume histogram with two simple moving averages (SMA 20 and SMA 50), helping traders detect volume trends and potential reversals.
📌 Useful for identifying strength of momentum and visualizing market sentiment clearly.
Features:
• ✅ Colored candles: green for bullish, black for bearish
• ✅ Orange square shows the position of the close (top, middle, or bottom of the candle)
• ✅ Volume bars with SMA 20 (orange) and SMA 50 (blue)
• ✅ Works on all timeframes
Developed by:
Version: 1.0
Language: Pine Script v5
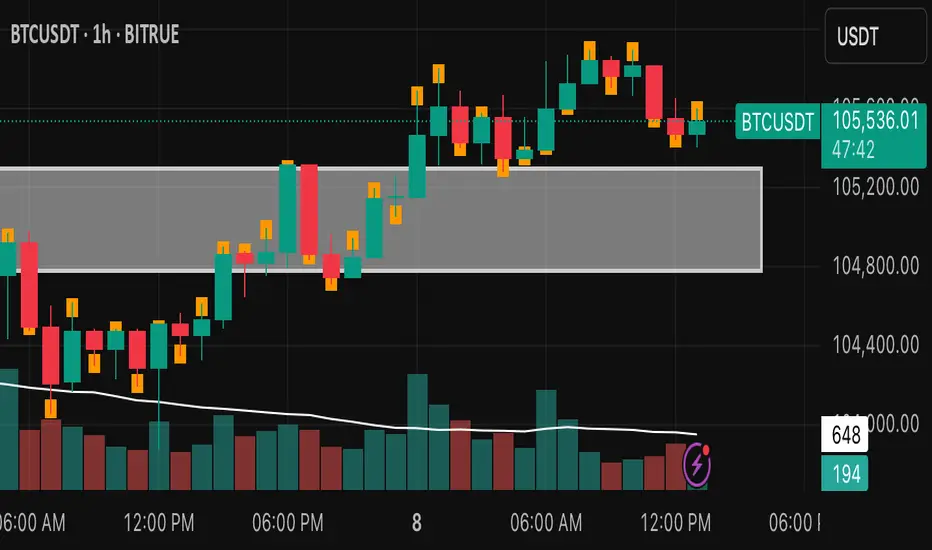
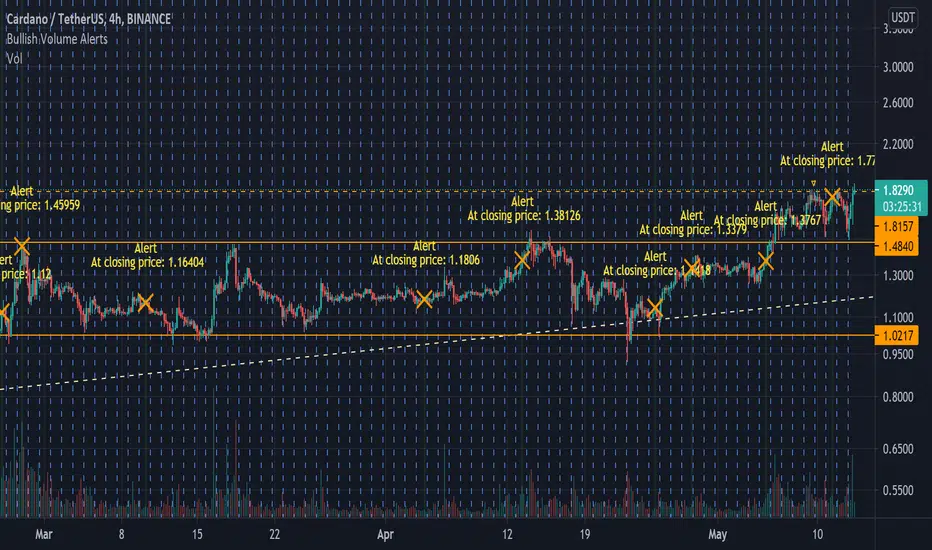
Bullish Volume [Alerts]A really simple script I made for someone, but also noticed I couldn't find anything like it that's as quick or simple (I may just be dumb)
Simply labels out and alerts you when three consequently higher volume bars appear, pretty useless on its own but for crypto, it works great to quickly notice if some important fundamentals suddenly cause the price to rocket. It works best with hour timeframes. Personally I'd use it with 4h.
I find it useful to know if something in a market is stirring attention and hope others can find it useful.
Volume Moving AveragesVolume Moving Averages that I find more useful than volume bars, personally.
Default settings:
* Fast line = 3 day lookback
* Slow line = 10 day lookback
Enjoy.

AlAlawi ~ Volume Confidence BreakoutThis is a Volume statistical mean and Lognormal deviation
This indicator shows X amount of Volume bars Lognormal Mean and Standard Deviation, then applies your confidence level.
Just hit like to keep getting free indicators!

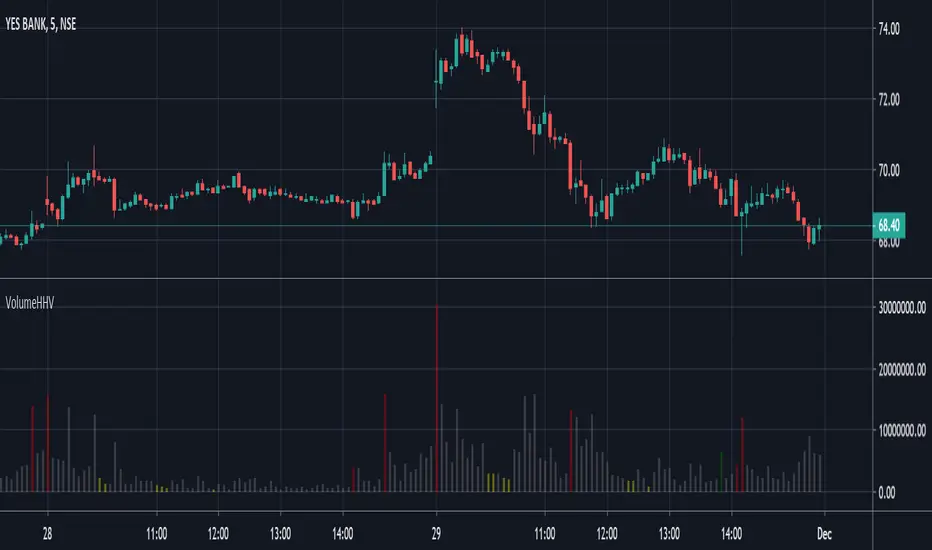
Volume_HHVVolume variation comparison : to detect High and Low of highest volume or lowest volume Bar in a Range

Tick ChartHello All,
Tick Chart is created using ticks and each candlestick in Tick Chart shows the price variation of X consecutive ticks ( X : Number of Ticks Per Candle ). for example if you set Number of Ticks Per Candle = 100 then each candlestick is created using 100 ticks. so, Tick Charts are NOT time-based charts (like Renko or Point & Figure Charts). Tick is the price change in minimum time interval defined in the platform. There are several advantages of Tick Charts. You can find many articles about Tick Charts on the net.
Tick Chart only works on realtime bars.
You can set " Number of Ticks Per Candle " and " Number of Candles" using options. You can change color of body, wicks abd volume bars as well.
The script shows current, minimum, maximum and average volumes. it also shows OHLC values on the last candle.
Tick Chart using different number of ticks
Volume info:
Enjoy!

Volume BalanceThe indicator colors the volume bars in two colors to display the Bullish and Bearish power.
There is two option of the indicator view. The first is the classic one. And the second is to show the Bullish and Bearish power separately.

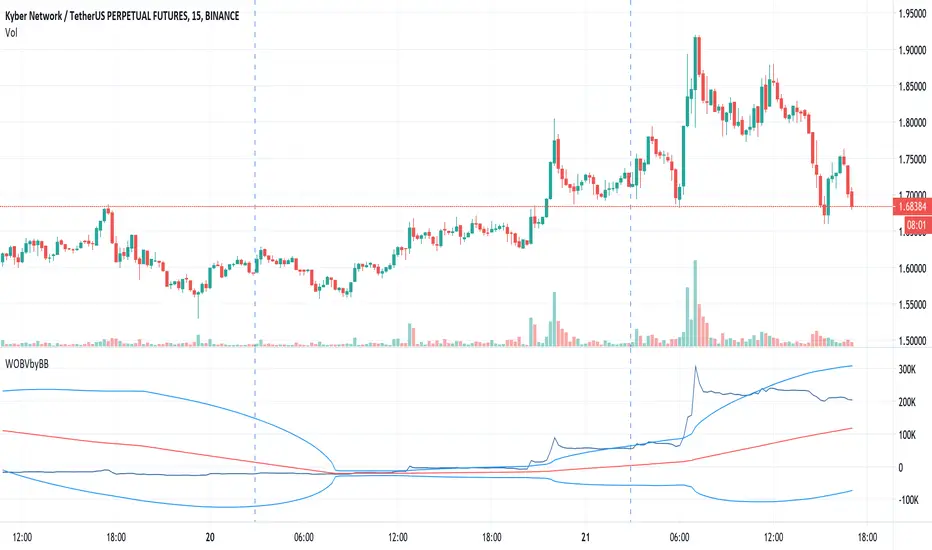
Weighted OBV by BB Original from www.tradingview.com I just added BB
Cumulative Force Indicator. Can also be seen as an OBV indicator that takes the price differences into account. In a regular OBV, a high volume bar can make a huge difference, even if the price went up only 0.01, and it it goes down 0.01 instead, that volume makes the OBV go down big time, even though in both cases hardly anything really happened. cForce is a more realistic view on where the money is flowing.
Volume Moving Average - evoThis script shows regular volume bars with two separate moving averages using only bullish and only bearish candles. The moving average uses the last known value of its calculation.
Using the Heikin Ashi function will smooth the colors and moving averages (good for trends):
The crossovers are a good way to see what the dominant direction of a trend is, if you test them on your time frame and instrument they might be good to trade on their own, I have not tested this and the default settings are not tuned for that.
As always, let me know if you like it or found a good way to use it :)

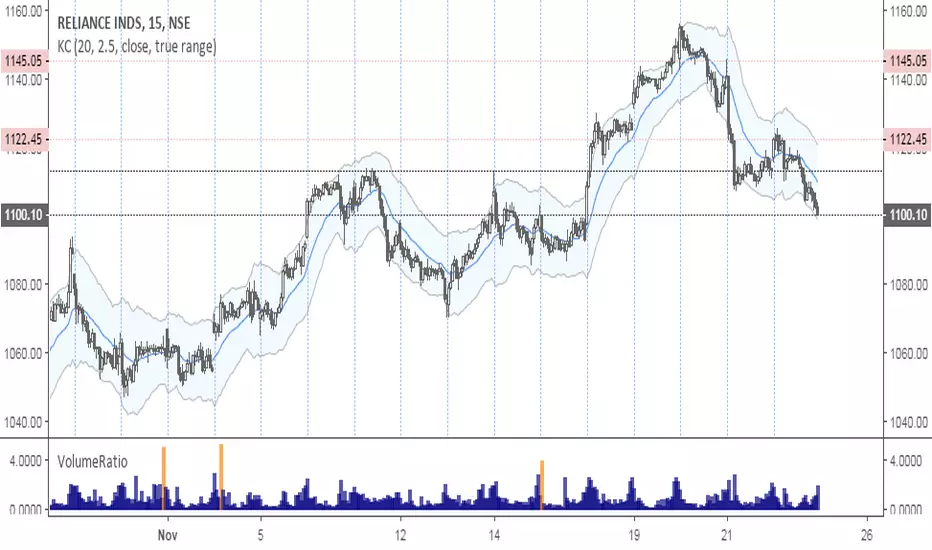
VolumeRatioVolumeRatio plots the high volume bar when volume is 3 times greater than average 36 day volume.